
ENSO forecast based on tidal forcing with an Artificial Neural Network
After the previous results which I got when I was using an Artificial Neural Network ANN and where I did an analysis of the correlations between the global mean temperature and possible forcing drivers, which can be viewed here, I turned my attention to the ENSO index by looking into the Multivariate ENSO Index (MEI).
One thing I found when I analyzed the result from correlations to ENSO was that there is a strong correlation between variations in Earth's rotations both to the global mean temperature and to the ENSO index. What we are talking about here are small variations in Earth's rotations, which are in the order of milliseconds. One other factor with correlation to the One other factor with correlation to the ENSO is of course SOI, but I also found correlations to SST, PDO, and the Kp and Ap indexes. |
From this, I concluded that either it is ENSO which is driving changes in Earth's rotation or it changes in Earth's rotation, which is causing variations in ENSO or more likely it is some combination of both.
Proof that ENSO and variations of Earth's rotation are proportionally correlated to each other has been known for some time. This can be seen here.
The mechanisms which tie ENSO and variations in Earth's rotation together are caused by sea current changes, changes in trade winds or by displacements of water between the equator and slightly higher latitudes. This all makes sense.
The water currents in the northern hemisphere follow a clockwise pattern, and in the Southern hemisphere they follow a counterclockwise pattern because of the Coriolis effect. The trade wind and the currents near the equator are moving to the west. However the Current closest to the equator called the equatorial counter current move to the east. Still deeper at depth down to 200 meters at the equator an ever stronger current is moving to the east.
The behavior of this current of the Equatorial Pacific is shown on this page by Bob Tisdale.
The only mechanism by which ENSO can be driven by changes in Earth's rotation is by variations in the tidal force.
My next step was to try to include tidal forcing in my ANN.
I then got three problems, which I had to overcome.
Firstly: I had to find data over the position and distance to the Moon and to the Sun. Eventually, I found software from which I could get this data, although it gave limited information and I was only able to print out time and position when the Sun and the Moon were closest and farthest from the Earth and with the Moon I could also calculate the time and position of the new moon, the full moon and the moon nodes. The Moon nodes are the location where the Moon cross over the ecliptic plane.
Secondly: I had to find the formula for the tidal force vector and implement this into my software.
Thirdly: I had to figure out what features in the tidal forcing which could affect ENSO. I had to experiment with different configurations based in my limited and rather crude data. To do this, I had to make complicated trigonometrically calculations in order to get the right value of the tidal force. Eventually, I got good correlations between ENSO and the tidal forcing. By this time, I had figured out which features in the tidal forcing that were causing this correlation. However it was not a direct correlation with ENSO, rather it was a correlation with the derivate signal of ENSO, i.e. it was affecting the rate of change of ENSO. The correlation to the change of rate in Earth's rotation, on the other hand, is direct. This means that tidal forcing is causing the rate of Earth's rotation to either speed up or speed down. The rate of rotation is then responsible for changes of the ENSO index. One reason was that it was difficult to identify, which features, which cause correlations. This was because each tidal forcing point I use is from the sum of monthly calculations. The size of the tidal forcing changes each and every day and how to summarize this data the right way into useful functions, which can be used to construct values that could create good correlations were difficult.
Of course, the tidal force is not the only factor which drives ENSO, but it is the most influential factor.
To test if that would be the case I ran my network with the right tidal forcing data. I also included feedback loops back in the network from the output ENSO values to some of the input nodes. After some testing and individual adjustments of the internal components in the artificial network, I got good results. Following on my earlier experiment of the ANN on the mean global temperature I trained the ANN from late 1978 up to the end of 2004. I used the time from 2005 up to the late 2011 for test the calculations, in order to find the minimal error function.

This is the result I got. The exciting thing with this result is that it is possible to make forecasts for much longer times into the future. Today's predictions use computer models and are only able to make credible predictions 4 to 5 months into the future. While in my case, using my ANN calculations based on tidal forcing it can be made for forecasts for an almost unlimited time because the Moon and Sun's positions into the future are known in advance. Although, I have to stress that with the predication so far it is not possible to get the last figure right. Currently, it is only possible to make an estimate with a relative high likelihood at any date if ENSO are going to be positive, negative or neutral. However, as can be seen here the predictions are not always correct. The main large El Niño events of 1982 and 1998 can clearly be seen, but the large magnitude of these events can not be predicted.
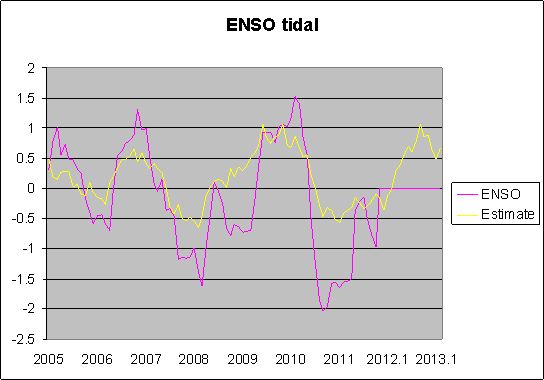
I later made a ENSO forecast from late 2011 up to 2020. This picture shows the test period and some of the forecast which ends in early 2013.
Note, however that the calculations from this graph, the ENSO index uses ENSO feedback values which all are from estimated ones. Those are not the real ENSO values.
Now Look at: the previous graph with the whole time span from 1979 up to 2011! On this graph, look at the beginning at the 3 first years from the start of 1979. These 3 first years have all exceptional good correlation to the real ENSO values. The difference with the start values in this case is that I use real ENSO values for the feedback values in the network calculations which are going into the calculations with values before the graph begins. This is because in my ANN, I use for every calculation point values which goes 3 years back in time and I must use real input values for values before my first calculated value.
If I would make a forecast for the next years using current real ENSO values from 3 years back and up to the current date, my forecast would be greatly improved and would be much better than forecasts made with current computer models. There were 2 important events that happened the years just after 1979. The first was the eruption of El Chichon in 1982 in Mexico. The second was the unusually strong el Niño event between 1982-1983.
My calculated values after 1982 of ENSO tend to come out of phase after and around 1982, and the ANN seems not to be able to handle strong El Niño's very well. After some years, the estimated ENSO value deteriorate somewhat mainly because of errors in the feedback caused by the inertia in Earth's rotation. In contrast to computer model forecasts, I don't use data from the Tropical Atmosphere Ocean TAO network which is a NOAA measurement network of buoys in the tropical Pacific that deliver real time data which feeds these ENSO models with real time data.
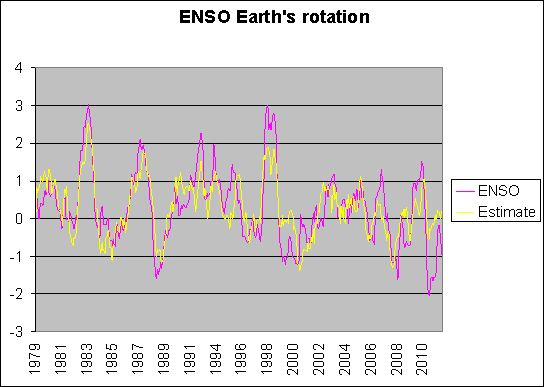
Here is a result from the same program, but as input it uses variations in the Earth's rotation instead of tidal forcing. As you can see, the correlation to the Earth's rotation makes the result much better. However in contrast to tidal forcing, future changes in Earth's rotation is unknown.

Here is another graph from the same program with feedback but this time the input signal is only from SOI Southern Oscillation Index. As expected SOI is closely related to ENSO.

Here is a repeat with the same program, but this time with a combination of tidal forcing, changes in Earth's rotation, SOI, Kp and the Ap indexes. As you can see, this result is similar to that of the previous with only SOI.
The next step I plan to take is to use the ANN with real time data and make more accurate ENSO predictions for the next 3 to 4 years in to the future. I also want to test with real ENSO input data for several time periods in order to evaluate statistically how the good predictions can be based on real time ENSO feedback input data for the beginning.
After that, I want to improve on my result by using more precise and accurate tidal calculations. I have found a program from which I can make precise calculations of the Moon and the Sun on a daily basis. Other factors I plan to look into are the mechanism of the Kelvin wave, Walker circulation and MJO which all should influence ENSO to some degree.
So far I have only looked at ENSO. I can easily switch to SOI, NOI and changes in Earth's rotation and use that as an output for predicting ENSO with the ANN.
Conclusion from my result is that tidal forcing is as a major factor in ENSO forcing. I now have gotten new questions. Compared with other causes how important is the effect from tidal forcing? Is it possible to find an increasing effect from tidal forcing by improving the tidal data I use? Is it, for example, possible to identify tidal forcing as the cause for the strong El Niño of 1982 and 1998?
It may be possible to get better ENSO results by using predictions based on SOI, NOI, Earth's rotations or by starting from tidal forcing only. I'll test and see. Also, ENSO and SOI are parameters for which there exists long historical data records. By, using a longer time span for training and testing, the accuracy of predictions based on ANN should be improved.
I acknowledge that it is not easy to find correlations between tidal forcing without testing out the right feature and by using an ANN. However I do find it very strange that no scientist to my knowledge has been looking into a possible connection between tidal forcing and ENSO in any depth.
As can be seen from what the IPCC writes about ENSO predictions, they do not have a clue. The current data models that are in use can only predict with any accuracy 4 to 5 months into the future. When it comes to the ENSO drivers, these researchers think chaos theory and random noise are the mechanisms which explains the causes of ENSO changes.
However Cerveny, R. S. and J. A. Shaffer (2001) et al. in the report, The Moon and El Niño, Geophys. Res., writes about the Moon cycles and ENSO, where they find correlations between the solar cycles and ENSO.
To me at least, it seems that the solution to long range ENSO prediction has for a long time been right in front of the eyes of these researchers, but nobody has taken up the challenge to figure it out.
I see the same reason why the climate community at large has not studied tidal forcing as an explanation for ENSO variations and why none TSI solar forcing as an additional cause for climate forcing is ignored. The primary reason is that they have had their education in meteorology, atmospheric physics, thermodynamics or in computer science. Most of them are specialists in a few narrow disciplines, and as such they prefer only to apply knowledge from the fields they know. They are not generalists and display strong resistance for applying knowledge from other area from which they lack knowledge. Then add to that group thinking, peer pressure and lack of funding for research in alternative causes of climate change and this explains the current one-sided situation. This is one of reason that predictions made with computer simulations are failing.
ANN are seldom used in climate science. There are some exceptions. One is research done by Dr William Hsieh from the University of British Columbia who uses this technique for ENSO predictions, but to my knowledge without using any tidal forcing. To learn more about how ANN works and how I have implemented this technique in climate investigation, C but to my knowledge without using any tidal forcing. To learn more about how ANN works and how I have implemented this technique in climate investigation, Click here
Update 24 April 2013:
I've updated the software. I'm now able to make better and more flexible ENSO forecasts.

This is an ENSO (MEI) forecast which I created in April 2013 and covers a period of 4 years into the future. This forecast is made with an Artificial Neural Network which uses tidal forcing as the main driver for ENSO.
The yellow line is from a run where tidal force input and seasonal signals are the only signals used as input into the ANN.
The blue line uses the same in-signals as in the yellow line. The difference is that I have added the integral values of the magnetic indices of Kp and Ap. The reason I use the integral values is that, by only use one of each, instead of three different signals the noise level is reduced. What I also want is the low frequency values.
The green line uses the same in-signals as in the blue. The difference is that I also added the integral value of PDO to the mix.
Of course, future values of the Ap, Kp and PDO indices are not known. However the general trends can be estimated. The magnetic vales of Ap and Kp while Solar Cycle 24 currently is near solar maximum are low. I think a double peak is going to happen at the end of this year. Therefore, both indices are slightly increased in my forecast for the remaining of this year. After that, both values are decreasing to very low values occurring at solar minimum expected sometime between 2021 and 2022.
PDO is now in its negative period. PDO is less predictable than Kp and Ap. However, I expect this value to continue to decrease.
Correlations exist between Kp, Ap and the PDO values with ENSO.
Why are Kp and Ap correlated to ENSO?
These values follow variations in the solar cycle, and it is known that precipitation increases during low solar activity. This has been measured by tracking water flows from rivers coming from the tropics, and this is probably linked to cloud height.
PDO and ENSO are interlinked. Probably PDO changes the thresholds when ENSO changes from neutral to El Niño/LA Niña and vice versa.
So how to interpret the current forecast?
I think that ENSO during the coming months is going to stay neutral or is going to go slightly negative. During the end of this year and the beginning of next year, we are going to see a moderate or weak El Niño. La Niña should occur at the end of 2014 and at the beginning of 2015. ENSO is going to be in neutral or in weak El Niño position at the middle of 2015. ENSO after that time is going to be and stay in neutral position until the latter part of 2017 when ENSO is going to enter a weak La Niña position.
I hope to be able to update this forecast 4 times a year.
My plan of the near future is this:
First I'm going to look at correlations between the tidal signal I use which is based on a modified derivate signal of the tidal vector I use in the ANN and with real measurements of sea level height made from satellites and data from the NOAA TAO buoy system using standard linear regression analysis. By doing this, I hope that I can establish more exact by which process tidal forcing affects ENSO.
Next step depending on the result I get should be that I'm going to improve the calculation of the tidal force I use in the ANN using more accurate formula and better position for the position of the Moon and the Sun.
Next step after that is that I am going to do the same analysis for the Southern Oscillation Index SOI, Length Of Day LOD and the Nino3.4 index that I have made for the ENSO (MEI) index.
By then combining the result I then get, I believe, I can improve forecast considerably for ENSO (MEI) index. One problem with the ENSO (MEI) index, I think, is that it is not a linear function in the same way as the other indices which are more linear in nature. El Niño is created by gradual warming of stagnant water while LA Niña is created by upwelling of cold water coming from the deep.
Update 4 February 2014:
My ENSO prediction has been delayed because I had to fix problems with some software errors and with the algorithm I use. This is now fixed.
My forecast is that at the end of this year 2014, ENSO is going to be in La Niña or neutral condition. However there is going to be a slow overall trend in the coming years towards higher ENSO values over several years.
What I have now found is that ENSO variation is driven by tidal forces which are modulated by variations in the Ap and Kp indexes.
This then creates fluctuations in the overall Coriolis driven sea current circulation in the Pacific. Imagine two wheels like in the number 8, where the direction of the rotations in the middle is from right to left. Now imagine that Pacific sea current circulations want to reach equilibrium in harmony with the Coriolis forcing.
Because of inertia in the Pacific Sea Currents this gives ENSO a semi-oscillation like pattern. This pattern is then constantly disturbed by tidal and solar magnetic disturbances. But because of the random appearance of the combined tidal and magnetic forcing the ENSO index looks unpredictable. But, its not.
Next step for me is to make the same type of calculations for SOI and LOD and add from that results and SOI And LOD as parameters into the ANN and which should further improve the ENSO calculations.
I plan to as fast as possible put together a power point presentation which show in detail how I discovered what I discovered and what I discovered. I am going to use this and present this to key people. Because I solved what cause the variation in ENSO I need to present this information with care.
It seems likely to me that the 60 year temperature cycle we see in the global temperature is to a large extend driven by variations in the frequency and intensity in El Niños which in turn is caused by magnetic modulations from the Sun. In other words, the ENSO induced temperature variation is not so much caused by variation in solar heat flux as it is caused by redistribution of heat out from the Pacific Ocean.
How do I think that variation in the magnetic field is causing changes in ENSO? I won't tell this at the moment, but I got an idea how this might work.